Introduction
Data analytics is simply the process of examining (inspecting, cleaning, transforming and modeling) raw sets of data with the aim of extracting meaningful insights to derive conclusions.
The conclusions from the data examined in the data analysis process ultimately enable us to make better and informed decisions. Guesswork will not always help to reach better conclusions.
Data analytics has seen a significant surge in popularity within the business landscape in recent years. It plays a crucial role in practically all aspects of modern business operations, contributing to efficiency gains, cost savings, better decision-making, and ultimately, driving growth and competitive advantage
Businesses use data analytics to draw lessons from past performance in order to improve future practices. The end goal is to ensure that they get more profit and minimize losses.
Data Analytics in social impact programs
The application of data analytics is different in social impact programs.
Data analysis in social impact programs involves using analytical techniques to assess, measure, and understand the effectiveness and outcomes of initiatives aimed at creating positive social change. It encompasses the use of data to evaluate the impact, efficacy, and efficiency of various social programs, interventions or policies.
Key Aspects of Data Analysis in Social Impact Programs
-
Outcome Measurement: Quantifying and evaluating the intended outcomes and impacts of social programs. This might include assessing changes in community well-being, educational attainment, health outcomes, poverty reduction, etc.
-
Performance Evaluation: Assessing the efficiency and effectiveness of program implementation, resource allocation, and operational aspects to ensure they align with program objectives.
-
Stakeholder Analysis: Understanding the perspectives and needs of stakeholders, including beneficiaries, donors, and implementing organizations, through data-driven insights.
-
Impact Assessment: Determining the direct and indirect effects of interventions on targeted beneficiaries or communities, often employing methodologies like randomized control trials (RCTs), quasi-experimental designs, or longitudinal studies.
-
Data Collection and Monitoring: Establishing robust data collection mechanisms and monitoring systems to track progress, measure outcomes, and adjust strategies as needed.
-
Insights for Decision-Making: Providing actionable insights to program managers, policymakers, and stakeholders to make informed decisions, allocate resources effectively, and refine program strategies.
-
Storytelling and Advocacy: Using data analysis to tell compelling stories and advocate for social change by presenting evidence-based findings and successes.
Social impact organizations center their thinking around assessing how programs impact beneficiaries. They pose questions such as:
- Given the needs of our beneficiaries, what interventions would be the most suitable and impactful?
- While a project is ongoing, questions like these are asked:
- Are we successfully meeting the intended outcomes of the project?
- How can we accelerate and amplify our achievements?
- Ultimately, the goal is to gather extensive insights from their interventions to apply these lessons to future efforts.
Whether used in business circles or in social impact, data analytics gives us one super-power, the ability to unearth patterns and trends from past events and use the insights to inform today’s decisions which will positively improve future outcomes.
Types of Data Analytics
There are 4 different types of data analytic.
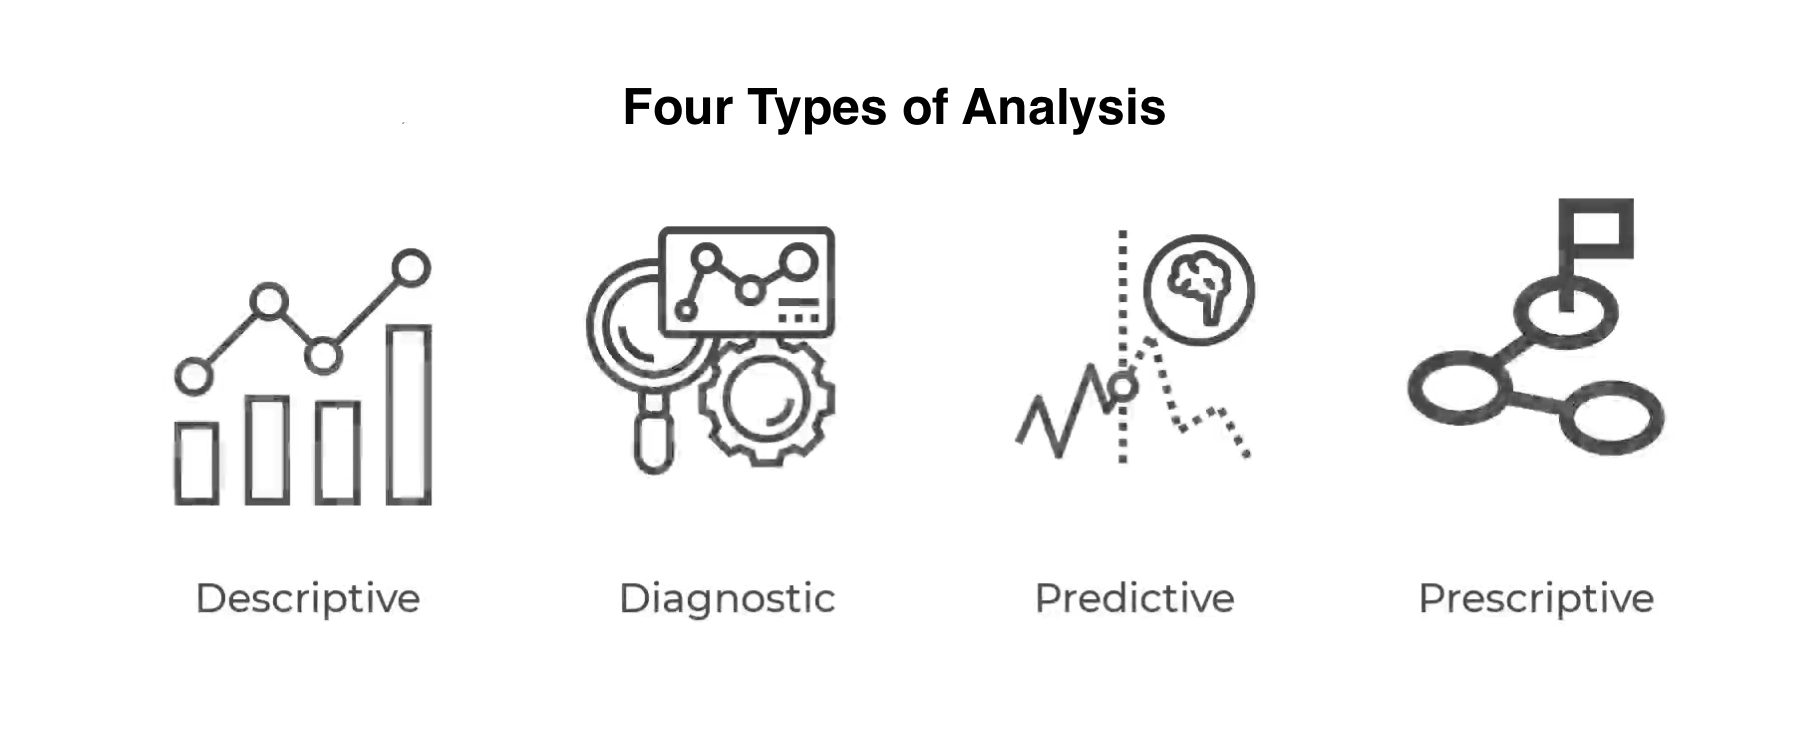
Descriptive Analysis: Summarizing and describing data through statistical measures, visualizations, and exploratory techniques to understand past trends and current states.
Descriptive analytics is all about summarizing past data to answer the question, “What happened?”
Imagine we're working on a project to improve water, sanitation, and hygiene. Descriptive analytics helps us understand what went on during the project. Did we lower cholera cases? Did more folks get clean water? Did they learn more about staying clean?
Diagnostic Analysis: Investigating data to determine why certain events or outcomes occurred, identifying root causes behind trends or issues.
Knowing what happened ( Descriptive Analytics) is just the start. We also want to understand why things happened the way they did. That helps us make better plans for the future. This is where diagnostic analytics comes in.
Say we find out what a community needs. Then, we want to understand why those needs are there. When we figure out what causes these needs, we can create an effective and sustainable plan.
Predictive Analysis: Employing statistical models, machine learning algorithms, and forecasting methods to make predictions about future trends, customer behavior, demand forecasting, etc.
Once we have stablished what happened and why it happened, we can now use the data to answer the question, what is likely to happen. This is where predictive analytics comes in.
We can look at past results to understand how much effort we need to make our plans work. For instance, to reduce cholera, we figure out how many latrines to build. Or if we give out fertilizer, we predict how many families will have enough food later. Predictive analytics helps us guess what might happen, not what surely will. The better the data we have, the better the guesses. Lastly, prescriptive analytics helps us decide the best actions based on what might happen.
Prescriptive Analysis: Recommending actions or strategies based on analytical insights to optimize decision-making processes.
Prescriptive analytics goes beyond predictions. It uses the guesses from predictive analytics to pick the best actions for getting the results we want. For instance, if we know what causes more cholera cases and what resources we have, we can decide the best way to help. Do we build latrines, make boreholes, or focus on teaching hygiene?
Key processes of data analytics
Data analytics involves several processes to extract insights and value from data. Here are the key steps in the data analytics process:
Data requirements specification
In this phase, you outline the specific data required, the methods and tools for collection, and the sources to be utilized.
Deciding what data to gather relies on the objectives of your data project. For instance, if you're collecting project monitoring or evaluation data, your framework with performance indicators guides what data to collect.
Data collection methods vary, including structured interviews with questionnaires, focus group discussions or observations. Information can also be sourced from platforms like accounting software or social media.
Data collection
Once your data needs are defined, the next step is actual data collection. This might involve interviewing respondents using developed questionnaires or extracting information from existing platforms.
The most common method for gathering data in social impact projects is structured or semi-structured questionnaires during interviews. Many organizations are shifting from paper forms to using mobile devices like smartphones and tablets for data collection.
Data cleaning
After gathering your data, the subsequent task involves ensuring its cleanliness to uphold the accuracy of your analyses.
You'll need to address quality concerns within the data, such as outliers—values notably higher or lower than most of the data. Managing missing or incomplete data is crucial, and ensuring proper formatting for each variable with the correct data type is also essential.
Data analysis and interpretations
Now that the data is all good, it's time to do analysis and interpretations using the four types of data analysis methods discussed earlier.
First, we'll look at the data in simpler ways and create data visualisations to see if you can find any patterns. Then, we'll dig deeper into the data to see how things are related and do some fancy math stuff using software like SPSS or STATA to understand it better.
Data presentation
Once we've checked out the data and understood it, we've gotta tell others about it.
The ultimate goal of data analytics is to inform decision making. Therefore, data presentation skills are very crucial for any data analyst working in social impact organizations.
Data can be presented through many mediums including written reports, stories, interactive dashboards or slideshows.
The most important thing is to ensure that data has been packaged in a way that will be understood by the target consumer and that it will inspire them to make informed decisions.
References & Resources
-
Andrea De Mauro, A. (2021). Data Analytics Made Easy. Packt. Link to Book.
-
Cole Nussbaumer Knaflic, A. (2015). Storytelling with Data: A Data Visualization Guide for Business Professionals. Wiley. Link to Book.
-
Data For Dev. (2023). Fundamentals of Data Analytics. Retrieved from Link.
GlenH - Nov 26, 2023gghayoge at gmail.com